Customer LTV
Know what a new customer is really worth.
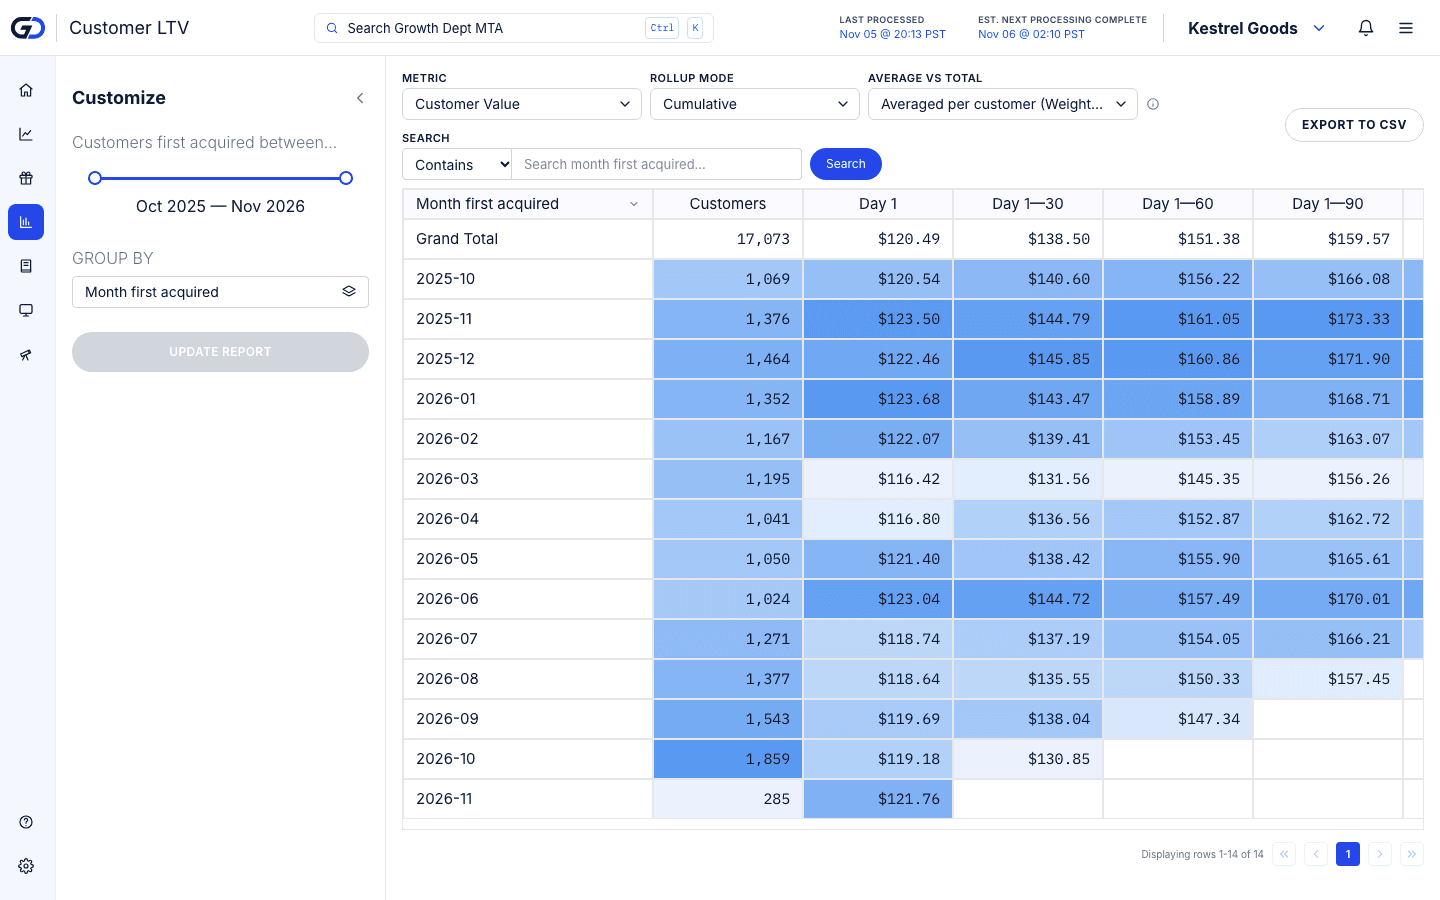
A first order rarely tells the whole story. Customer LTV follows each month's new customers and what they spend afterwards, out to two years, so you know how much you can afford to pay for the next one.
 Shopify
 Meta
 Google Ads
 TikTok
 YouTube
 Instagram
 Snapchat
 Pinterest
 Microsoft Advertising
 Amazon Ads
 AppLovin
 Reddit
 LinkedIn
 X
 The Trade Desk
 Vibe
 MNTN


 OpenAI Ads
 Klaviyo
Cohorts
Group customers by how they started.
Group by the month or week of the first order, the products in it, or the discount code used on it.
Grouping by first product shows which items bring in customers who come back. A single ROAS number can't tell you that.
Over two years
Follow every cohort to day 720.
Day 1 is the day of the first order. Each step adds the next 30 days, as revenue per customer or in total.
LTV comes from your Shopify orders alone, with test, cancelled and $0 orders left out, so it matches your store's own history.
Payback
See when a customer pays you back.
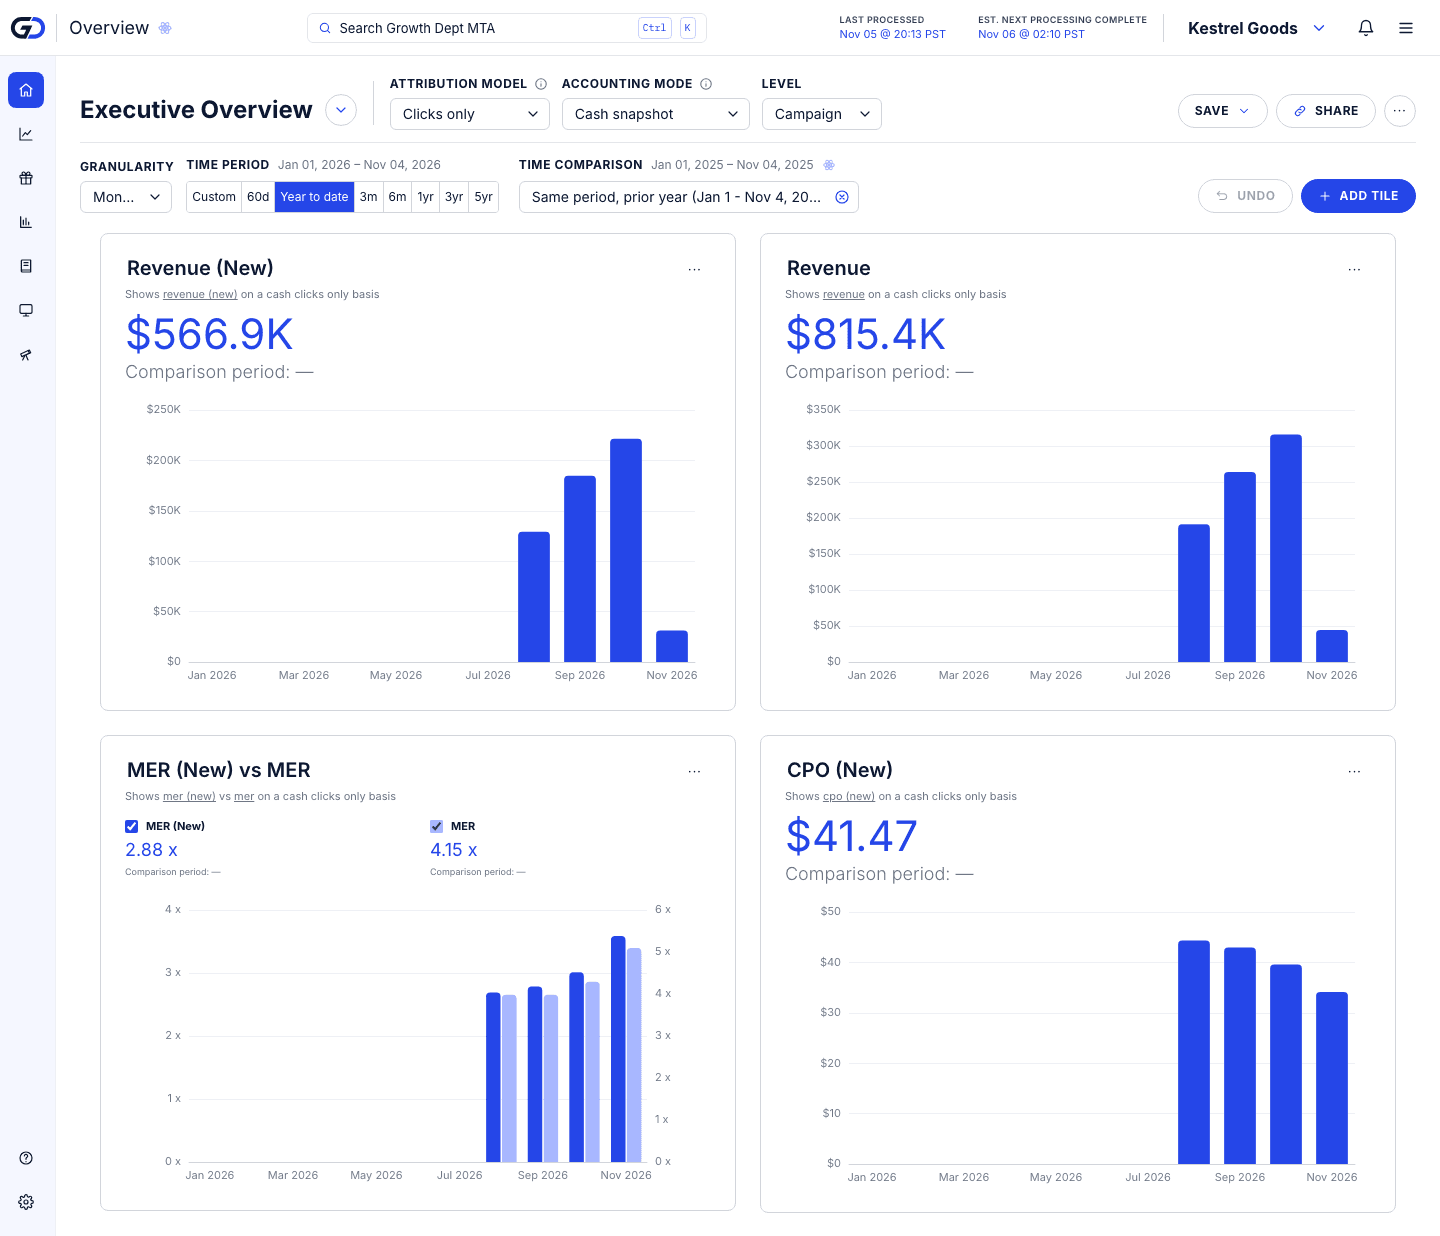
Take what you paid for a new customer from Sales attribution, then read the same cohort's spend at day 30, 90 and 180 here. The point where one passes the other is your payback.
Export any cohort table when you want it in a spreadsheet.
Ask it
Answers to the questions you ask every week.
Each card opens the report that answers it.
What is a customer we won in January worth by day 90?
Group customers by the month of their first order and follow what they spend, out to two years.
Customer LTVOpen itWhich campaigns brought in new customers last week, and what did each one cost?
New-customer revenue, orders and cost per new customer for every platform, campaign, ad set and ad.
Sales attributionOpen itWhich products do our TikTok ads actually sell?
Revenue for each product with the share of spend that sold it, by platform, campaign and ad.
Product attributionOpen itHow many touches does a purchase usually take?
The most common routes to a purchase, with the orders and revenue that followed each.
Customer pathsOpen itCan we put these numbers next to the rest of our data?
Pull any report as CSV files into your own warehouse, on your schedule.
Export APIOpen it
Numbers that add up.
Three rules every report keeps, checked by automated tests on every change.
1×
Each sale counted once
However many platforms claim an order, its revenue is split across the touches that led to it and never counted twice.
= Shopify
Totals match your store
Orders with no tracked ad get their own Unattributed row, so changing the model moves credit between rows and never changes the total.
1 currency
Spend and revenue in yours
Spend billed in another currency is converted once, at that day's European Central Bank rate, so ROAS never mixes two currencies.
Find out which ads really sell.
Book a 45-minute call with the Growth Dept team. We look at how you measure sales today and show you what MTA would add.