Multi-touch attribution
Put your budget where it sells.
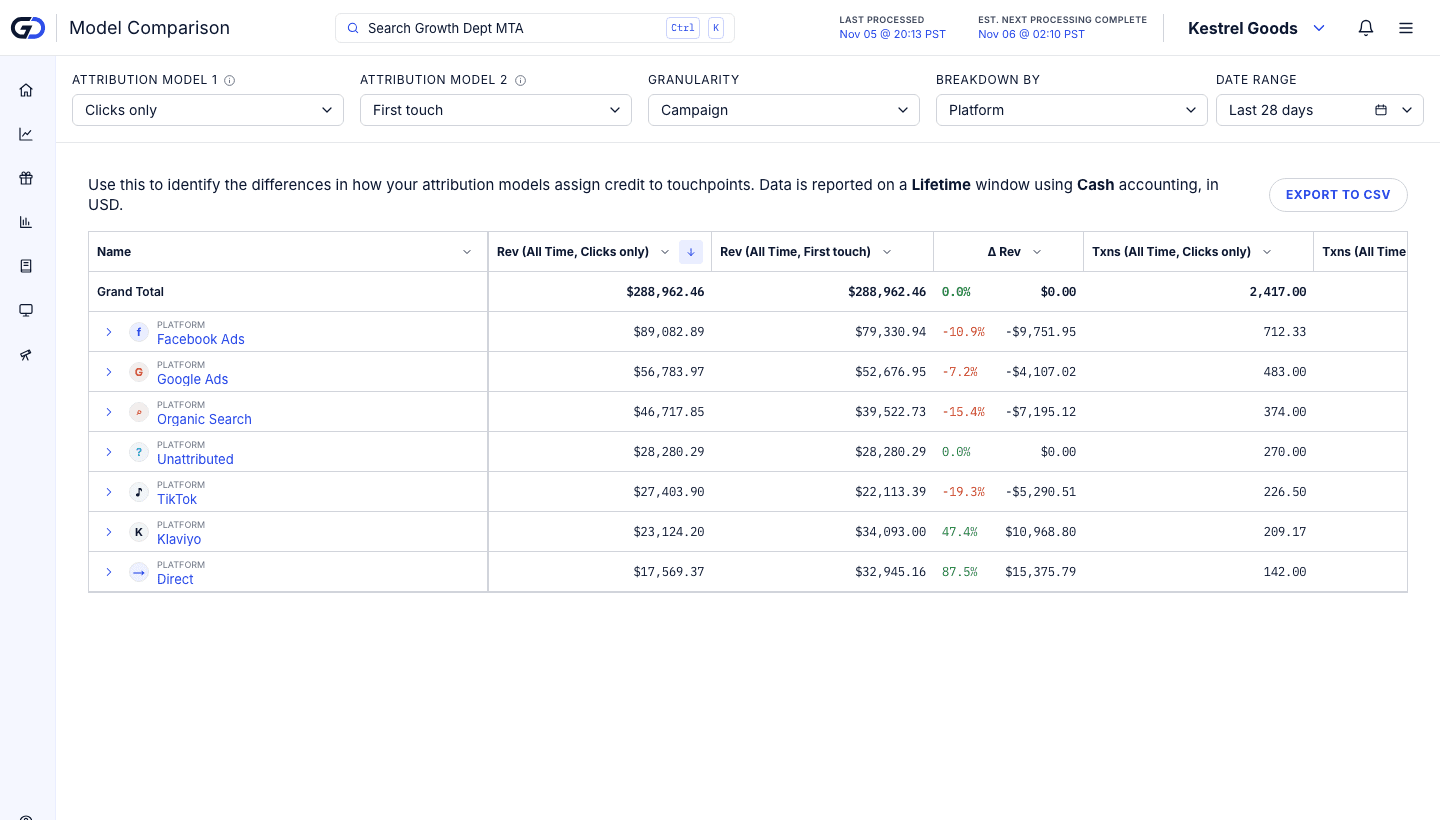
Every ad platform reports its own version of your sales. MTA follows each buyer from the first ad to checkout, matches them to the Shopify order, and splits the revenue across the ads that earned it. Spend sits on the same row, so ROAS and cost per customer come from one place you can check.
 Shopify
 Meta
 Google Ads
 TikTok
 YouTube
 Instagram
 Snapchat
 Pinterest
 Microsoft Advertising
 Amazon Ads
 AppLovin
 Reddit
 LinkedIn
 X
 The Trade Desk
 Vibe
 MNTN


 OpenAI Ads
 Klaviyo
Why it holds up
Attribution you can check.
Every number in a report goes back to a visit on your site, an order in your store or a platform's own spend figure.
Your own data
Visits come from a pixel on your own site, orders from Shopify and spend from each platform. Every order in a report is a real order from your store.Seven ways to read a sale
Choose how credit is shared and how long an ad keeps it. Model comparison puts every model side by side for the same dates.One total, whatever you pick
Sales with no tracked ad get their own row, so every model adds up to the revenue your store took.
Sales attribution
Every campaign's real return, in one table.
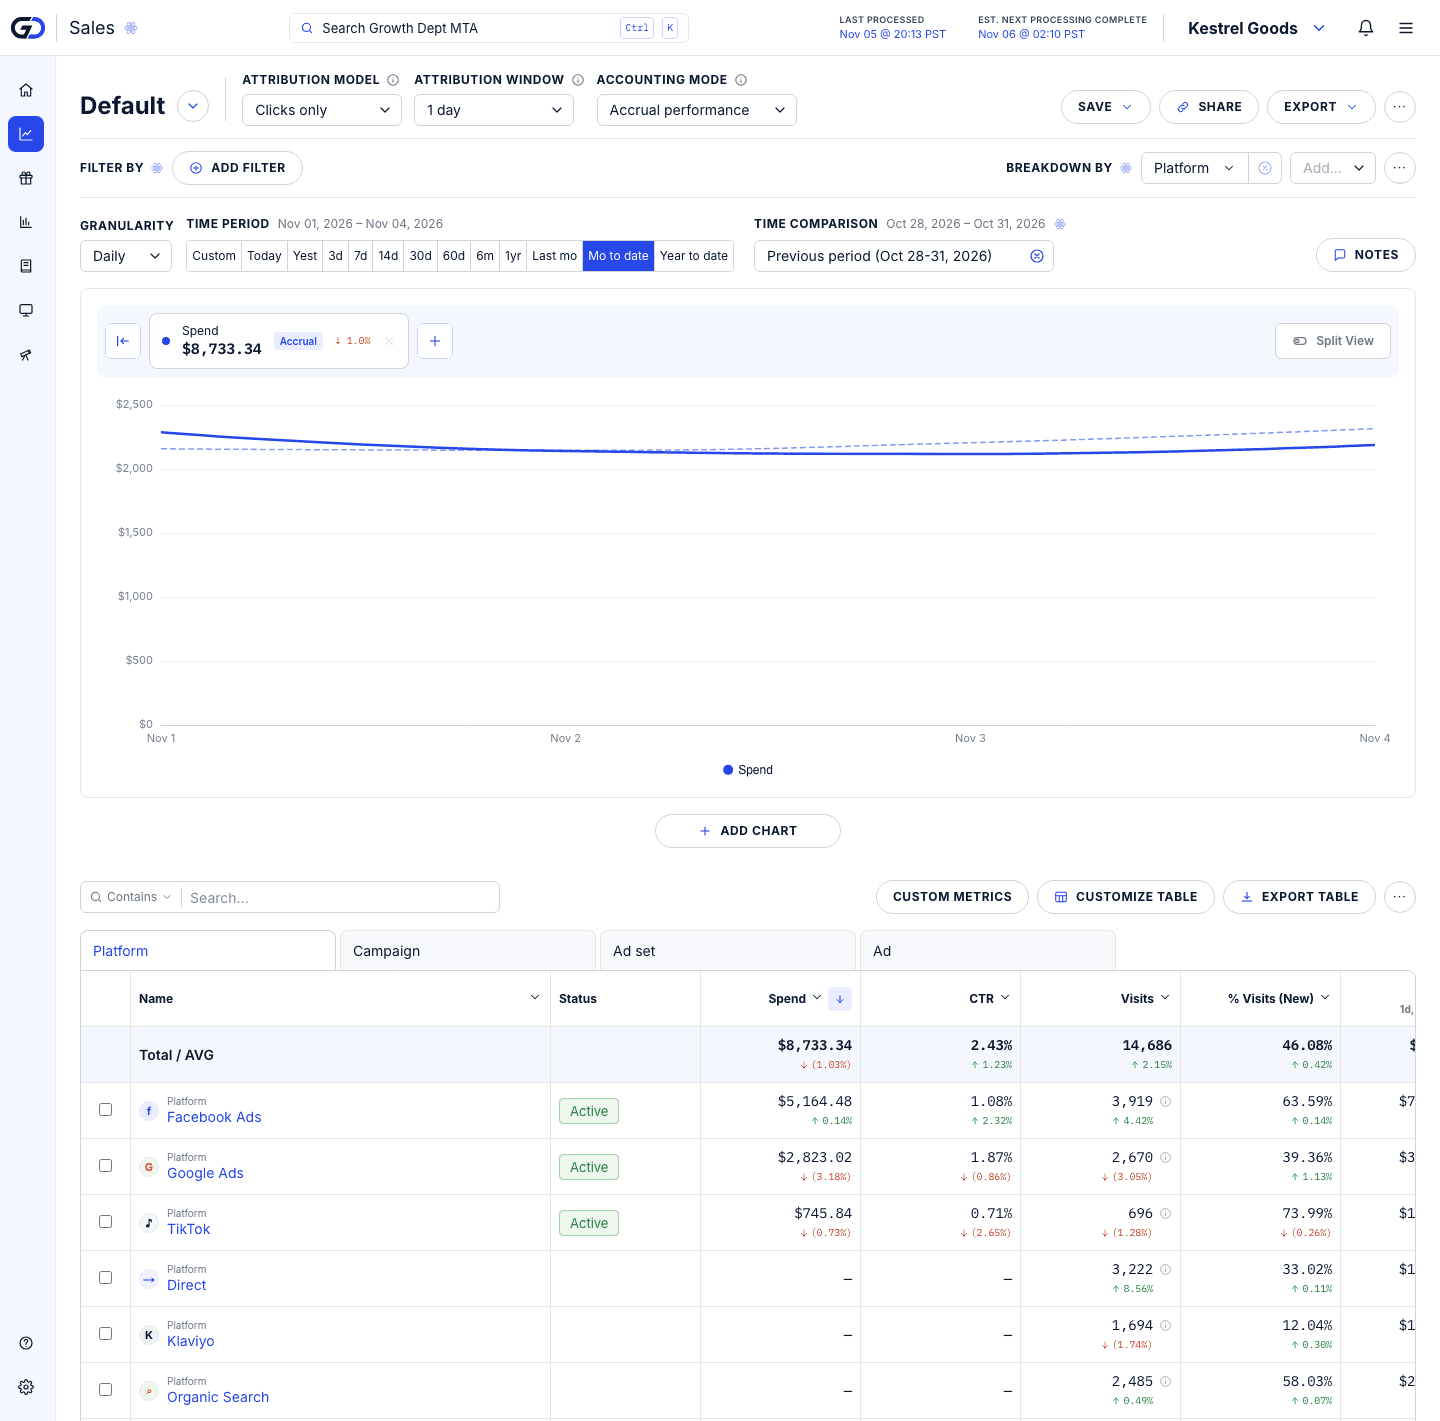
Spend, visits, orders, revenue, ROAS and cost per customer for each platform, then down through campaigns and ad sets to single ads, for any dates you pick.
Find the campaigns worth more budget and the ones to switch off, without adding up four dashboards that disagree.
Clicks + views
Credit for ads people saw and didn't click.
Clicks + Modeled Views, fitted per brand
unpaid orders(day) =
weekday + trend
+ Σ coefficient(platform) × impressions(day and day before)
coefficients ≥ 0 · video views as a second input where reported
- 1Weekday and trend take out the regular rhythm of your unpaid orders.
- 2What is left is shared out by each platform's impressions, and no platform can take credit away.
- 3A day's view credit stops at the number of unpaid orders that day.
Refitted nightly over up to 120 days. Needs 28 days of orders with pixel data.
Video and reach ads often start a purchase that ends days later with a typed address. Two views models give those ads a fair share: one uses the view-through purchases Meta, Google Ads and TikTok report, the other estimates views from impressions.
Orders and products
Open any order and see what sold it.
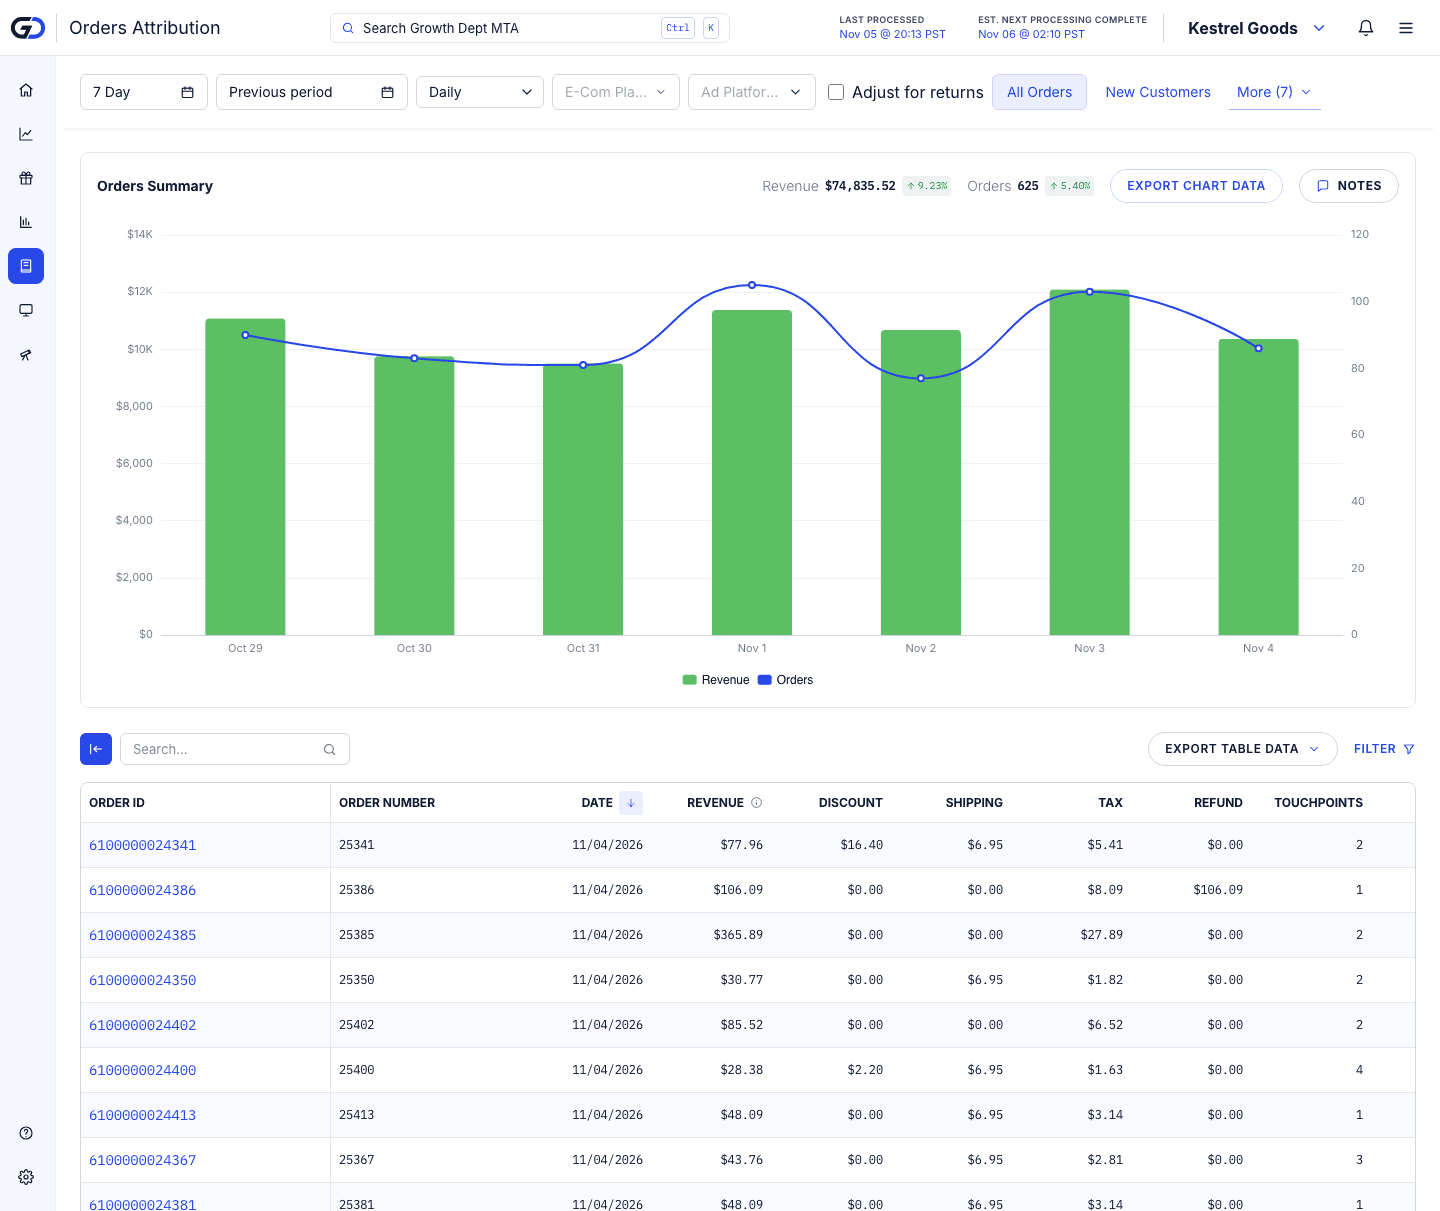
Each order lists the ads and visits that led to it, in order, with the share of credit each one got. Product attribution does the same for what was in the basket.
Windows and accounting
Judge the ads, or match your Shopify total.
Same order, two ways to date it
Accrual performance
On the day of the click: judge the week's ads by what they went on to sell.
Cash snapshot
On the day of the order: adds up to what Shopify recorded that day.
Illustrative: an ad click on Monday, the order on Thursday.
Decide how long a click keeps credit: from 1 day to 90 days, or for good. Then pick which day the revenue lands on.
Accrual performance puts revenue on the day of the ad click, so you can judge this week's ads on the sales they started. Cash snapshot puts it on the day of the order, so it adds up to what Shopify recorded.
Integrations
Every platform, read the same way.
 Shopify
 Meta
 Google Ads
 TikTok
- Pixel
- Orders API
- Spend API
- Export API
Shopify for orders, and Meta, Google Ads and TikTok for spend, with connectors built for 14 more ad platforms. Email, SMS, organic and referral traffic is sorted into channels from its links and tags, with nothing extra to connect.
Ask it
Answers to the questions you ask every week.
Each card opens the report that answers it.
Would this campaign still look good if we judged it differently?
See the same channels and dates under every attribution model, side by side.
Model comparisonOpen itWhat did this buyer see before they ordered?
Every order lists the ads and visits that led to it, in order, and the credit each one got.
OrdersOpen itDid this week's ads earn their spend, or is revenue just landing this week?
One view dates revenue to the ad click, to judge the ads. The other dates it to the order and matches Shopify.
Accounting viewsOpen itWhich campaigns brought in new customers last week, and what did each one cost?
New-customer revenue, orders and cost per new customer for every platform, campaign, ad set and ad.
Sales attributionOpen itAre our video ads behind sales that show up as direct traffic?
Switch on a views model and see which ads earn credit from people who watched and bought later.
Clicks + viewsOpen itHow many touches does a purchase usually take?
The most common routes to a purchase, with the orders and revenue that followed each.
Customer pathsOpen it
Find out which ads really sell.
Book a 45-minute call with the Growth Dept team. We look at how you measure sales today and show you what MTA would add.