Creative analytics
Scale the creative that sells.
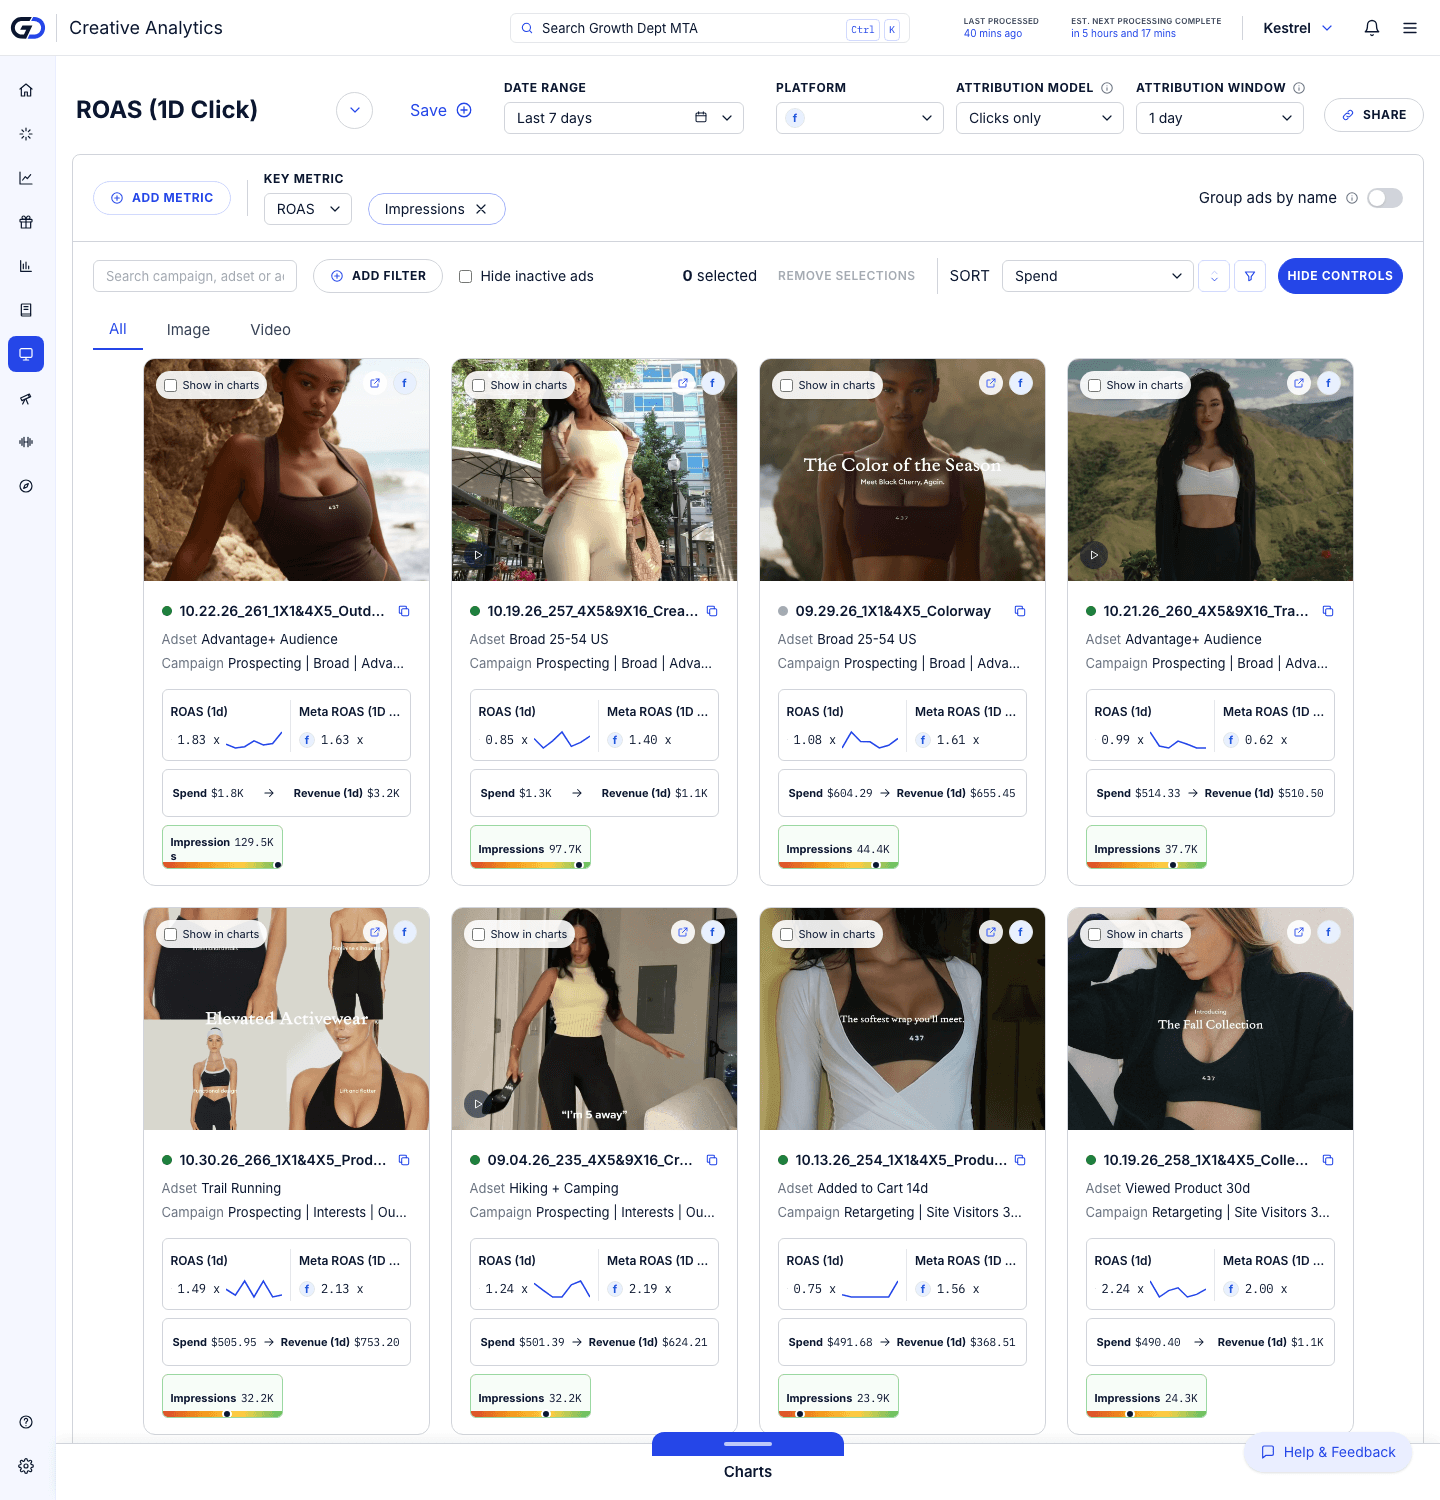
Every ad appears as a card with its image or video, its spend, and the revenue your store credits to it. The platform's own number sits beside it, so an ad that only looks good in Ads Manager can't fool you.
 Shopify
 Meta
 Google Ads
 TikTok
 YouTube
 Instagram
 Snapchat
 Pinterest
 Microsoft Advertising
 Amazon Ads
 AppLovin
 Reddit
 LinkedIn
 X
 The Trade Desk
 Vibe
 MNTN


 OpenAI Ads
 Klaviyo
Ad cards
Each ad, with the sales behind it.
Images, videos and names come straight from Meta, Google Ads and TikTok. Each card carries spend, revenue, ROAS and cost per customer, counted the same way as everywhere else in MTA.
Switch the attribution model or window and every card follows, so an ad's card always agrees with its row in Sales attribution.
Two numbers
The platform's claim beside the truth.
What the platform says an ad earned and what your orders credit it with, side by side and clearly labelled. When the platform's number is much higher, it is counting sales other ads and channels also helped make.
That gap is often the difference between scaling an ad and cutting it.
Compare
Find the ads worth more budget.
Sort by spend, revenue or ROAS, filter by platform, search by name, and pin up to four ads to chart them side by side.
Hand your creative team a short list of what to make more of, backed by real orders.
Ask it
Answers to the questions you ask every week.
Each card opens the report that answers it.
Which ads claim more sales in the platform than they actually drove?
Each ad shows the platform's own reported revenue beside the revenue your orders credit to it.
Creative analyticsOpen itWhich campaigns brought in new customers last week, and what did each one cost?
New-customer revenue, orders and cost per new customer for every platform, campaign, ad set and ad.
Sales attributionOpen itWhich products do our TikTok ads actually sell?
Revenue for each product with the share of spend that sold it, by platform, campaign and ad.
Product attributionOpen itAre our video ads behind sales that show up as direct traffic?
Switch on a views model and see which ads earn credit from people who watched and bought later.
Clicks + viewsOpen itIs our Meta spend lifting branded search?
Put Meta spend beside Google brand-search revenue and see how closely the two move together.
Metrics explorerOpen it
Explore
More ways to find what sells
Numbers that add up.
Three rules every report keeps, checked by automated tests on every change.
1×
Each sale counted once
However many platforms claim an order, its revenue is split across the touches that led to it and never counted twice.
= Shopify
Totals match your store
Orders with no tracked ad get their own Unattributed row, so changing the model moves credit between rows and never changes the total.
1 currency
Spend and revenue in yours
Spend billed in another currency is converted once, at that day's European Central Bank rate, so ROAS never mixes two currencies.
Find out which ads really sell.
Book a 45-minute call with the Growth Dept team. We look at how you measure sales today and show you what MTA would add.